

The article aims to discuss 6 tips that could help diagnose and fix performance problems in your Go applications.
Benchmarking:
Writing effective benchmarks in Go is crucial for understanding the performance of your code. Benchmarks can be created by adding the suffix “_test” to a Go file and using the testing package’s Benchmark function. Here’s an example:
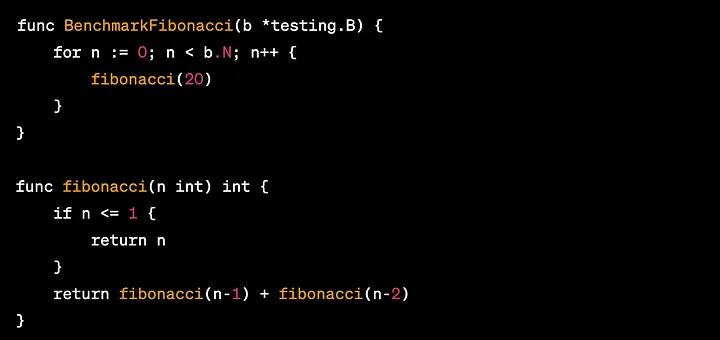
In this example, we’re benchmarking the time it takes to calculate the 20th Fibonacci number. The BenchmarkFibonacci function runs the fibonacci function b.N times, which is a value set by the testing package to provide a statistically significant result.
To interpret benchmark results, we can run go test -bench=. -benchmem in the terminal, which will execute all benchmarks in the current directory and print memory allocation statistics. The -bench flag is used to specify a regular expression for matching benchmark names, and . will match all benchmarks in the current directory. The -benchmem flag will print memory allocation statistics along with timing results.
Profiling:
Go has built-in profiling tools that can help you gain insight into what your code is doing. The most common profiling tool is the CPU profiler, which can be enabled by adding the -cpuprofile flag to the go test command. Here's an example:
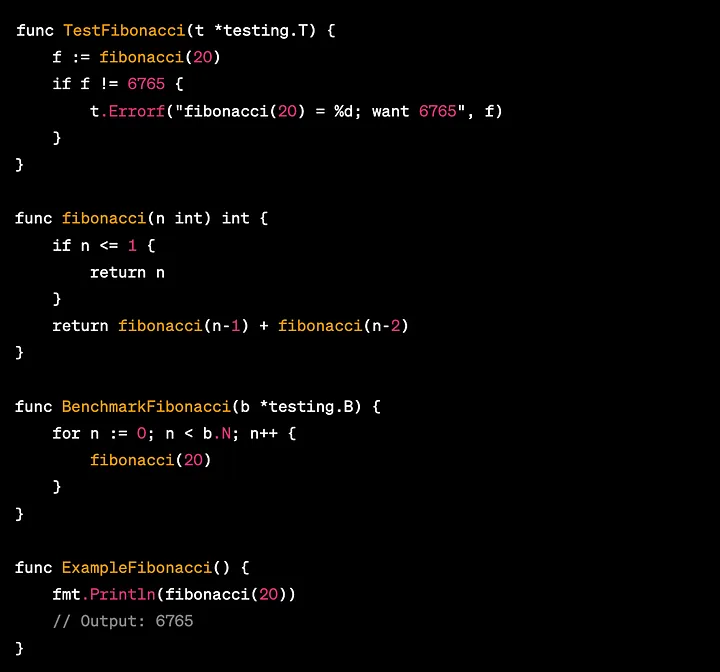
The first function, “TestFibonacci”, is a simple unit test that checks if the fibonacci function correctly returns the 20th number in the fibonacci sequence.
The “fibonacci” function is a recursive implementation of the fibonacci sequence that calculates the nth number in the sequence.
The “BenchmarkFibonacci” function is a benchmark that runs the “fibonacci” function 20 times and measures the execution time.
The “ExampleFibonacci” function is an example that prints the 20th number in the fibonacci sequence using the “fibonacci” function and checks if it equals to the expected value of 6765.
To enable profiling, we use the “-cpuprofile” flag with the “go test” command to output the profiling results to a file called “prof.out”. The following command can be used to run the tests and generate the profiling data:

go test -cpuprofile=prof.outAfter running the tests, we can use the “go tool pprof” command to ana
lyze the profiling data. We can start the pprof tool with the following command:

This will open the pprof interactive shell, where we can type various commands to analyze the profiling data. For example, we can use the “top” command to display the functions that consumed the most CPU time:

This will display a list of functions with the highest CPU time usage, sorted by CPU time. In this case, we should see the “fibonacci” function at the top of the list, since it was the function that consumed the most CPU time during the benchmark.
We can also use the “web” command to display the profiling data in a graphical format, and the “list” command to display the source code annotated with profiling data.
Profiling is a powerful tool that can help us identify performance bottlenecks in our code. By using the “-cpuprofile” flag and the go tool pprof, we can easily generate and analyze profiling data for our Go tests and applications.
Compiler optimizations:
The Go compiler performs several optimizations, including inlining, escape analysis, and dead code elimination. Inlining is the process of replacing a function call with the function’s body, which can improve performance by reducing function call overhead. Escape analysis is the process of determining whether a variable’s address is taken, which can help the compiler allocate it on the stack instead of the heap. Dead code elimination is the process of removing code that is never executed.
Inlining:
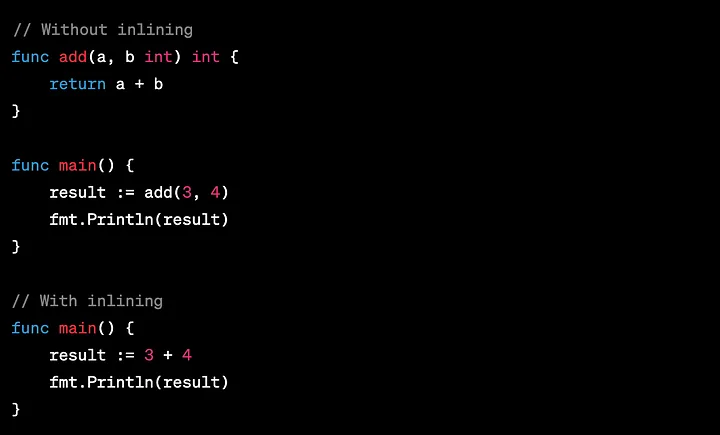
In the first example, the add function is called with arguments 3 and 4, which results in a function call overhead. In the second example, the function call is replaced with the actual code of the function, resulting in faster execution.
Escape Analysis:
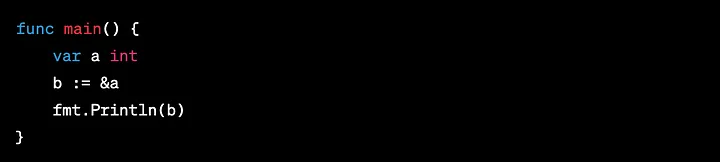
In this example, the a variable is allocated on the stack, since its address is not taken. However, the b variable is allocated on the heap, since its address is taken with the & operator.
More on escape analysis:
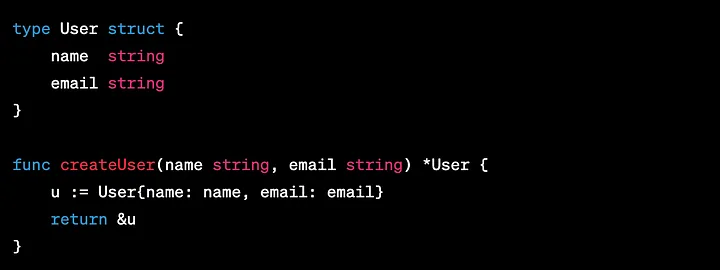
In the createUser function, a new User is created and its address is returned. Notice that the User value is allocated on the stack since its address is returned, so it does not escape to the heap.
If we add a line that takes the address of the User value before returning it:
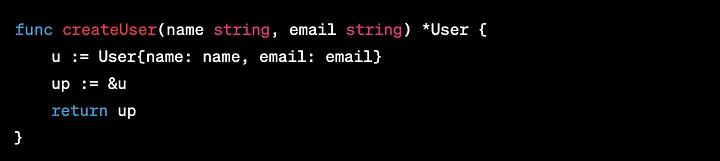
Now, the User value's address is taken and stored in a variable that is returned. This causes the value to escape to the heap instead of being allocated on the stack.
Escape analysis is important because heap allocations are more expensive than stack allocations, so minimizing heap allocations can improve performance.
Dead Code Elimination:
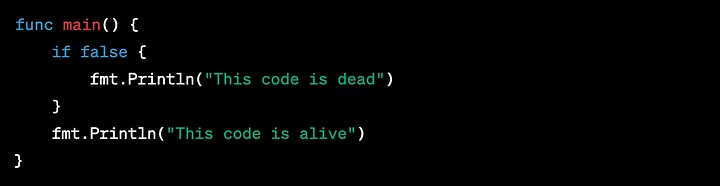
In this example, the code inside the if statement is never executed, so it is removed by the compiler during dead code elimination.
Understanding the Execution Tracer:
The execution tracer in Go provides detailed information about what’s happening in a program, including stack traces, goroutine blocking, and more. Here’s an example of how to use it:
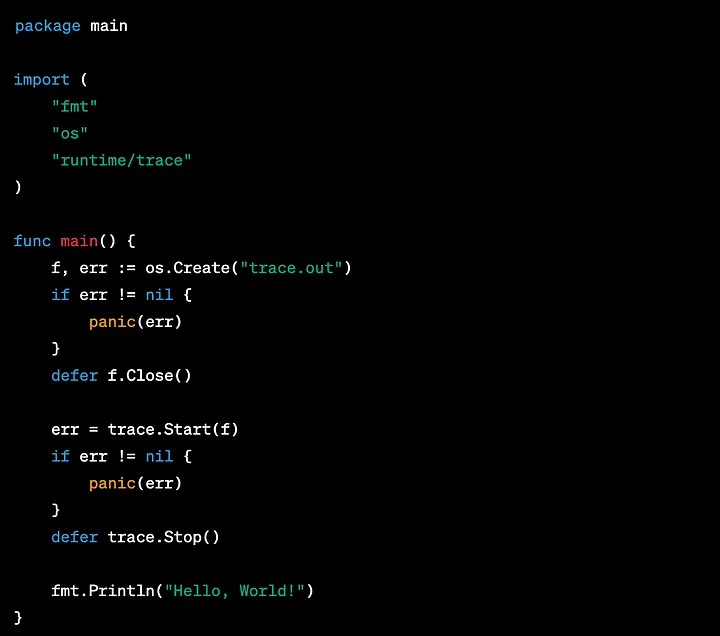
In this example, we’re creating a trace file, starting the trace, and then stopping the trace. When the program is run, the trace data will be written to the trace.out file. You can then analyze this trace data to better understand what’s happening in your program.
Memory Management and GC Tuning:
In Go, garbage collection is automatic and managed by the runtime. However, there are some ways to tune the garbage collector to improve performance. Here’s an example of how to set some of the garbage collector options:
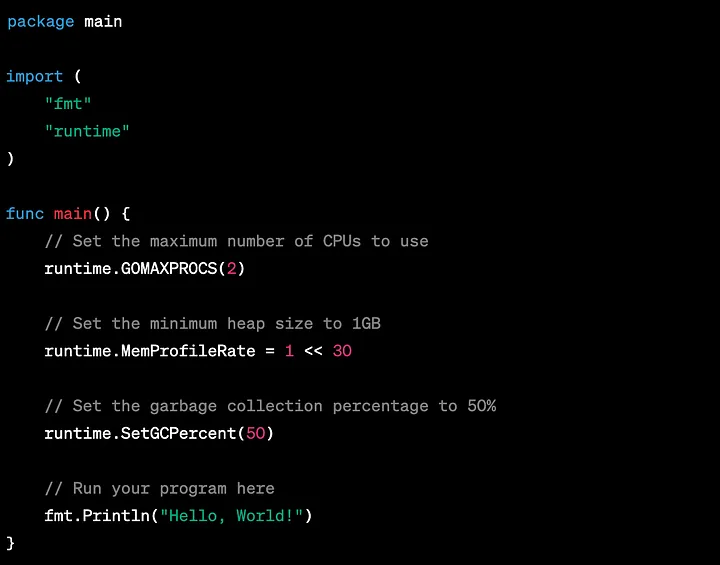
In this example, we’re setting the maximum number of CPUs to use, the minimum heap size, and the garbage collection percentage. These settings can be adjusted to improve performance depending on the needs of your program.
Check Go Advanced Topics Deep Dive — Garbage Collector to learn more.
Concurrency:
Go has built-in support for concurrency through goroutines and channels. However, it’s important to use these features correctly to avoid issues like race conditions and deadlocks. Here’s an example of how to use channels to safely communicate between goroutines:
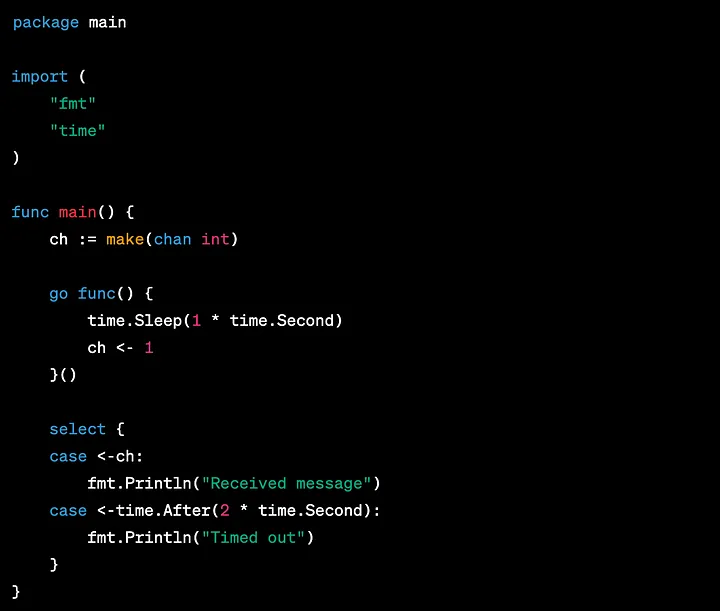
The make(chan int) statement creates a channel that is used to communicate an integer value between the two goroutines.
The first goroutine is created with the go func() {...}() statement, which sends a value of 1 into the channel ch after sleeping for 1 second. This means that after 1 second, the ch channel will have a value of 1.
The second goroutine is created with the select statement, which waits for communication on the ch channel. If a value is received from the channel, the message "Received message" is printed. If a value is not received within 2 seconds, the message "Timed out" is printed.
So although there is no explicit communication between the select statement and the first goroutine, there is still communication happening through the shared channel ch.
At Last:
If you like this article, please follow or subscribe to receive high-quality contents in time. Thank you for your support ;)


